Debugging Guide#
Warning: You should only use these tools actively while debugging and preferably only in simulation, because it slows down the control loop.
When a motion does the wrong thing — or the controller fails to produce a command at all — you need to see what Giskard is computing internally. This guide covers three tools, each answering a different question:
Debug expressions let you track any symbolic expression (a scalar or a spatial type) that a node computes, so you can watch it change over time.
Visualize them live in RViz to answer “where is this point/vector/pose right now, and where does the goal want it?”
Plot them to a PDF to answer “how did this value evolve over the whole motion?”
The
QuadraticProgramDebuggeranswers “why did the QP behave this way?” — it labels the raw solver arrays with constraint and degree-of-freedom names so you can read bounds, weights, and constraint violations by name.
Debug expressions#
A DebugExpression
(giskardpy.motion_statechart.graph_node.DebugExpression) wraps three things:
a
name, used as the label in every debugging tool,an
expression— either aScalaror a spatial type (Point3,Vector3,Quaternion,RotationMatrix,HomogeneousTransformationMatrix, orPose), anda
color, used when the expression is rendered.
A node registers a debug expression by appending it to artifacts.debug_expressions inside its
build_artifacts() method:
from semantic_digital_twin.world_description.geometry import Color
from giskardpy.motion_statechart.graph_node import DebugExpression

artifacts.debug_expressions.append(
    DebugExpression(
        name=f"{self.name}/current_normal",
        expression=root_V_tip_normal,
        color=Color.from_rgba(red=1, green=0, blue=0, opacity=1),
    )
)
See tasks/align_planes.py for a worked example. For Cartesian tasks there is a convenience
helper, CartesianTask.add_goal_and_current_debug_expressions(artifacts, goal, current)
(tasks/cartesian_tasks.py), which registers <task name>/goal (green) and
<task name>/current (red) so the two can be told apart in RViz.
Every node’s debug expressions are gathered through
DebugExpression.collect_from(statechart); the visualizer and plotter below consume that
list, so you only have to register the expression once.
Note
Plain Scalar expressions are plotted but not drawn in RViz — only spatial types become
markers. Use the plotter to inspect scalars.
Visualizing debug expressions in RViz#
The DebugExpressionPublisher
(giskardpy.motion_statechart.debug_expression_publisher) turns every spatial-typed debug
expression into an RViz marker and republishes it whenever the world state changes.
You do not construct it directly. Instead, add the DebugExpressionPublishing extension to
the executor:
from cramph.context import StatechartContext
from cramph.executor import StatechartExecutor
from giskardpy.motion_control import MotionControl
from giskardpy.motion_statechart.debug_expression_publisher import (
    DebugExpressionPublishing,
)
from giskardpy.motion_statechart.ros_context import RosNodeAccess

executor = StatechartExecutor(
    context=StatechartContext(world=world),
    extensions=[RosNodeAccess(node), MotionControl(), DebugExpressionPublishing(node)],
)
executor.compile(motion_statechart)
On compile(), the extension builds the publisher and attaches it to the statechart. Each
expression’s name becomes the marker namespace and label, so individual expressions can be
toggled on and off in RViz’s display tree. Vector3 expressions are anchored to their
visualisation_frame so the arrow is drawn at the right body.
This is the right tool for spatial reasoning: comparing a goal pose against the current pose, checking which way a normal points, or confirming a point is where you expect it in the world.
Each spatial type renders as a different marker, and the <task name>/goal (green) /
<task name>/current (red) convention makes the comparison easy to read:
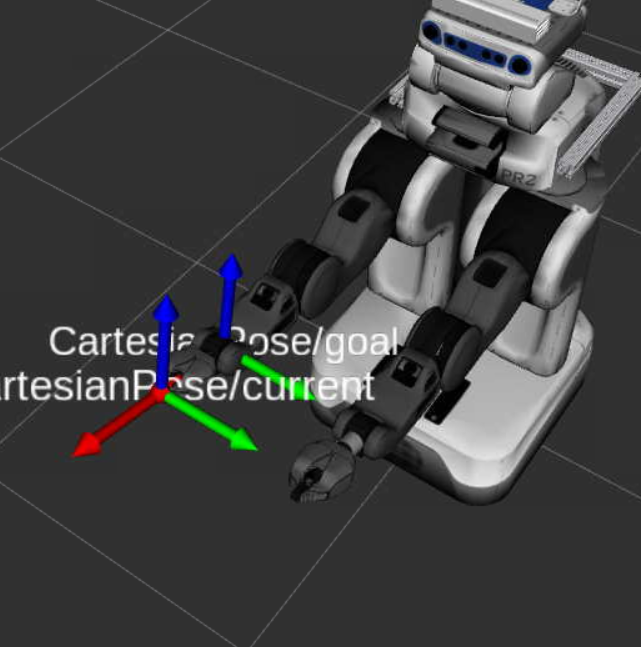
Fig. 1 A Pose is drawn as a coordinate frame. Here CartesianPose/goal and CartesianPose/current
show the target and actual end-effector pose side by side.#
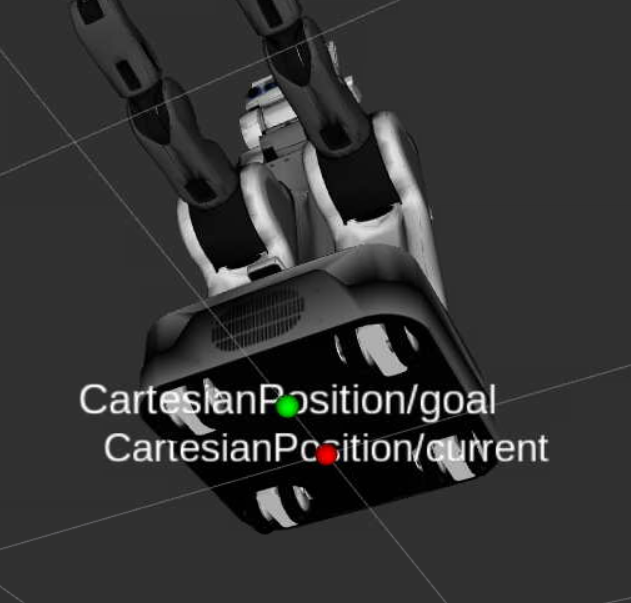
Fig. 2 A Point3 is drawn as a sphere — CartesianPosition/goal (green) and
CartesianPosition/current (red).#
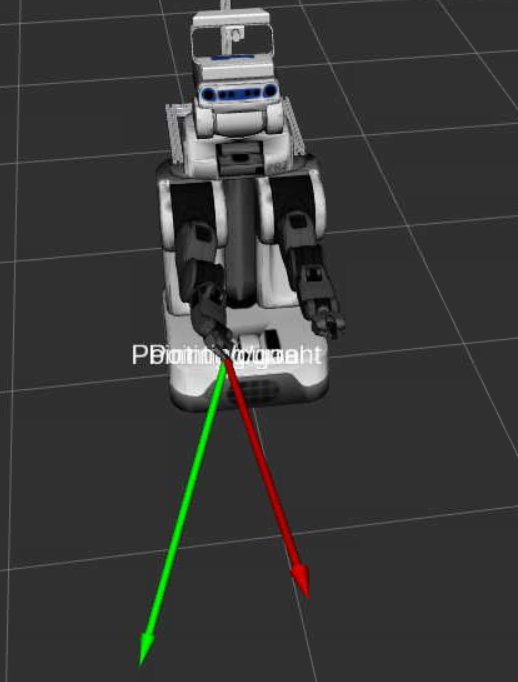
Fig. 3 A Vector3 is drawn as an arrow anchored to its visualisation_frame. Here the green
Pointing/goal and red Pointing/current arrows show where the robot should point versus
where it currently points.#
Plotting debug expressions#
To see how debug expressions evolve over an entire motion, add a DebugExpressionRecording
(giskardpy.motion_control) to the executor, after MotionControl. It holds a
DebugExpressionTrajectoryPlotter
(giskardpy.motion_statechart.plotters.debug_expression_trajectory_plotter):
from cramph.context import StatechartContext
from cramph.executor import StatechartExecutor
from giskardpy.motion_control import DebugExpressionRecording, MotionControl

executor = StatechartExecutor(
    context=StatechartContext(world=world),
    extensions=[MotionControl(), DebugExpressionRecording()],
)
executor.compile(motion_statechart)
executor.tick_until_end()
executor.require_extension(DebugExpressionRecording).plotter.plot(
    "./debug_expressions.pdf"
)
The lifecycle is:
compile()calls the plotter’sreset(...), which builds a fresh trajectory fromDebugExpression.collect_from(statechart)and discards any previous recording.Every
tick()appends the value of each expression after the commands of that tick were applied.plotter.plot(file_name)writes the PDF.require_extensionraisesMissingExecutorExtensionErrorif the executor has noDebugExpressionRecording.
The plot has one subplot per expression and one line per scalar component, sharing a common time
axis — for example a Point3 produces four lines (its homogeneous x, y, z, w components). The
plotter exposes a few layout knobs: subplot_height_in_cm, second_width_in_cm, and legend.
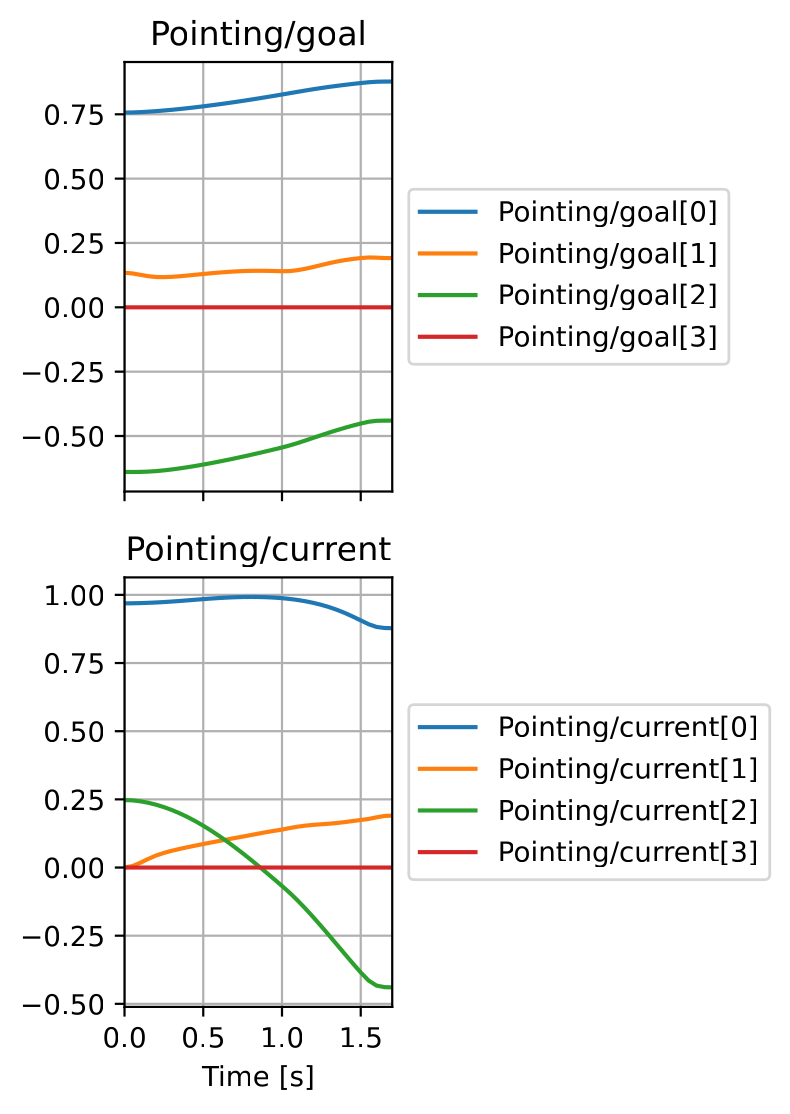
Fig. 4 An example plot for a pointing task: the Pointing/goal and Pointing/current Vector3
expressions, each split into their four homogeneous components, show the goal vector and the
current vector converging over the motion.#
For a runnable end-to-end example, see
test/giskardpy_test/test_motion_statechart/test_debug_expression_trajectory.py.
Inspecting the QP with QuadraticProgramDebugger#
When implementing new motion statechart nodes, the controller may produce an unintended command, runs into limits, or the solve fails.
To debug this, it may help to look directly into the quadratic program (QP) itself.
The QP is just large, anonymous numeric arrays;
the QuadraticProgramDebugger (giskardpy.qp.qp_debugger) re-labels those arrays with the corresponding
constraint and degree-of-freedom names and exposes them as pandas.DataFrames, so you can read
the problem by name.
Every QPController builds one automatically as controller.debugger (with no solution yet).
To inspect it:
you should run the program in debug mode
place a break point in the last line of
QPController.compute_command(...)add a watch saying
self.debugger.update(solution)(when the solve fails, useupdate(None))look at
self.debuggerin the debugger
Reading the output#
The debugger produces five labeled frames:
direct_limits— one row per free variable, with its lower/upper box bounds, the solution value, and its quadratic and linear weight. Use it to spot a variable pinned at a bound, a zero or oversized weight, or a solution that landed outside its box. Constraints with a weight of0are inactive and will havenanvalues.equality_constraints— columns for the constraint value (matrix × decision variables, excluding slack), theslack(bounds − value, i.e. how much the constraint is violated), and thebounds. A largeslackpinpoints the violated equality constraint by name.inequality_constraints— same as the previous, but for inequality constraints.equality_matrix/inequality_matrix— the labeled constraint matrices (rows are constraint names, columns are degree-of-freedom names). It’s essentially a Jacobian matrix, so look at how degrees of freedom influence your constraints.0means no influence, a positive value means increasing the value will also increase constraints’ expression, a negative value means decreasing the value will increase the constraints’ expression.